Topics -> js, chartjs, jquery, html, css, webdevelopment
Preview Link -> DataVisualisation
Source Code Link -> GitHub
What We are going to do?
- Creating chart container
- Adding options to change the charts.
- Integrating the chartjs cdn
- Adding Event Handler
What is ChartJS?
Chart.js is a free open-source JavaScript library for data visualization, which supports 8 chart types: bar, line, area, pie, bubble, radar, polar, and scatter.
JQuery
jQuery is a JavaScript library designed to simplify HTML DOM tree traversal and manipulation, as well as event handling, CSS animation, and Ajax.
Step 1 -> Creating chart container (index.html)
It will hold the chart position
<div class="chart-container">
    <canvas> id="chart3"></canvas>
</div>
Step 2 -> Adding options to change Chart Type.(index.html)
We are using the option tag to change between the charts like bar, pie, line and etc
<div class="chart-toolbar">
    <select id="pick">
        <option value="">Select one...</option>
        <option value="bar">bar</option>
        <option value="line">line</option>
        <option value="radar">radar</option>
        <option value="pie">pie</option>
    </select>
</div>
Step 3 -> Adding options to change Chart Type.(index.html)
First we need to import the both the libraries using cdn.
$(function () {

    ......

    // Start chart
    Chart.defaults.global.animation.duration = 2000; // Animation duration
    Chart.defaults.global.title.display = false; // Remove title
    Chart.defaults.global.title.text = "Chart"; // Title
    Chart.defaults.global.title.position = 'top'; // Title position
    Chart.defaults.global.defaultFontColor = '#999'; // Font color
    Chart.defaults.global.defaultFontSize = 10; // Font size for every label

    // Chart.defaults.global.tooltips.backgroundColor = '#FFF'; // Tooltips background color
    Chart.defaults.global.tooltips.borderColor = 'white'; // Tooltips border color
    Chart.defaults.global.legend.labels.padding = 0;
    Chart.defaults.scale.ticks.beginAtZero = true;
    Chart.defaults.scale.gridLines.zeroLineColor = 'rgba(255, 255, 255, 0.1)';
    Chart.defaults.scale.gridLines.color = 'rgba(255, 255, 255, 0.02)';
    Chart.defaults.global.legend.display = false;

    setChart3();
    function setChart3() {
        var chart = document.getElementById('chart3');
        var myChart = new Chart(chart, {
            type: chartType,
            data: {
                labels: ["January", "February", "March", "April", 'May', 'June', 'July', 'August','September','October','November','December'],
                datasets: [{
                    label: [1,2,3,4,5,6,7,8,9,10,11,12],
                    fill: false,
                    lineTension: .3,
                    pointBorderColor: "transparent",
                    pointColor: "white",
                    borderColor: '#d9534f',
                    borderWidth: 2,
                    showLine: true,
                    data: [9,7,4,6,3,4,7,1,2,3,5,7],
                    pointBackgroundColor: 'transparent',
                },
                ]
            },
        });
    }
});
Hurray! we are almost done
Step 4 -> Adding Event Handler
We will use the onchange event handler to configure our chart.
                            $(function () {

                                'use strict';
                                var chartType="line";
                                $('select').on('change', function() {
                                    chartType = this.value;
                                    setChart3();
                                });

                                ....
                            });
Whole js code at once
$(function () {

    'use strict';
    var chartType="line";
    $('select').on('change', function() {
        chartType = this.value;
        setChart3();
    });

    // Start chart
    Chart.defaults.global.animation.duration = 2000; // Animation duration
    Chart.defaults.global.title.display = false; // Remove title
    Chart.defaults.global.title.text = "Chart"; // Title
    Chart.defaults.global.title.position = 'top'; // Title position
    Chart.defaults.global.defaultFontColor = '#999'; // Font color
    Chart.defaults.global.defaultFontSize = 10; // Font size for every label

    // Chart.defaults.global.tooltips.backgroundColor = '#FFF'; // Tooltips background color
    Chart.defaults.global.tooltips.borderColor = 'white'; // Tooltips border color
    Chart.defaults.global.legend.labels.padding = 0;
    Chart.defaults.scale.ticks.beginAtZero = true;
    Chart.defaults.scale.gridLines.zeroLineColor = 'rgba(255, 255, 255, 0.1)';
    Chart.defaults.scale.gridLines.color = 'rgba(255, 255, 255, 0.02)';
    Chart.defaults.global.legend.display = false;

    setChart3();
    function setChart3() {
        var chart = document.getElementById('chart3');
        var myChart = new Chart(chart, {
            type: chartType,
            data: {
                labels: ["January", "February", "March", "April", 'May', 'June', 'July', 'August','September','October','November','December'],
                datasets: [{
                    label: [1,2,3,4,5,6,7,8,9,10,11,12],
                    fill: false,
                    lineTension: .3,
                    pointBorderColor: "transparent",
                    pointColor: "white",
                    borderColor: '#d9534f',
                    borderWidth: 2,
                    showLine: true,
                    data: [9,7,4,6,3,4,7,1,2,3,5,7],
                    pointBackgroundColor: 'transparent',
                },
                ]
            },
        });
    }
});
Superb, We have done it.
Deployment
For deployment, We are using the GitHub Pages. For More Info
Web Preview / Output
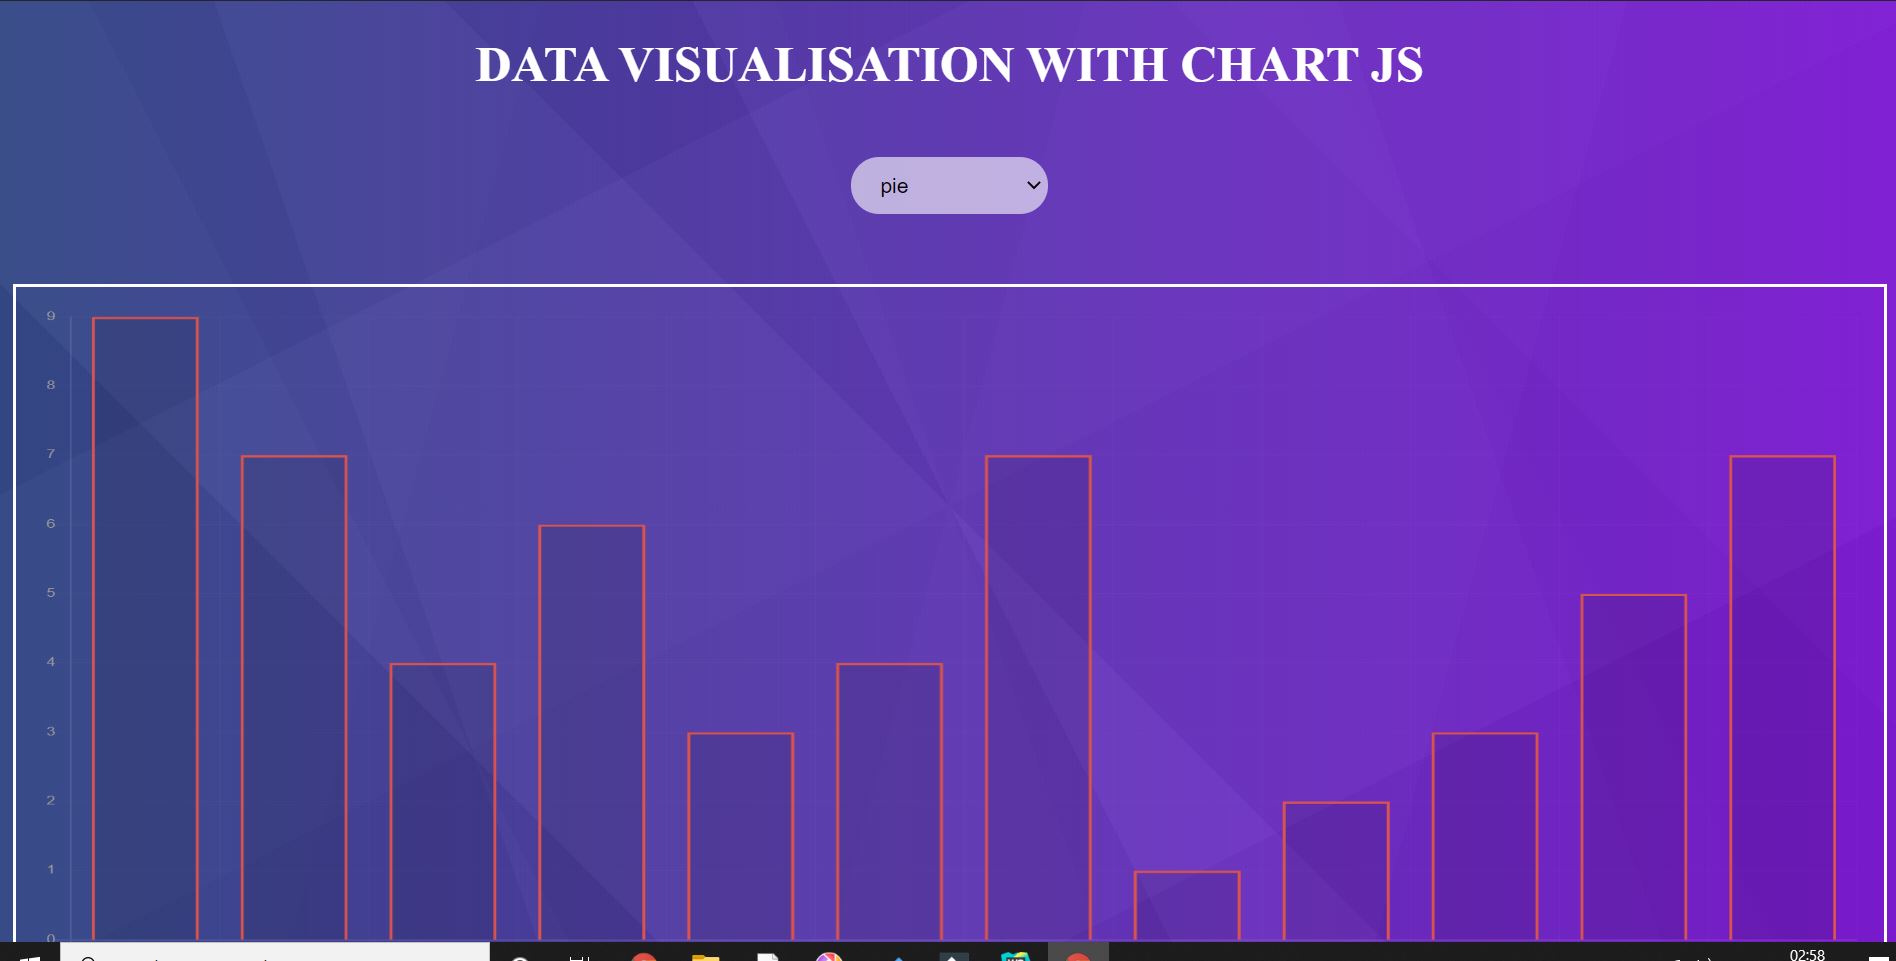 Web preview on deployment
Placeholder text by Praveen Chaudhary · Images by Binary Beast